
The Cumulative Flow Diagram (CFD) is used extensively in most Agile frameworks. It was popularised by Kanban, where “Visualise the flow” is one of the six leading practices.
CFD shows the amount of work that is currently in a particular stage of the development cycle and thus serves as a visual representation of the stability of the development process. It can be considered as an extension of the burnup graph. CFD interpretations
There are many variations of CFDs. Some show the amount of work in the backlog, others do not, some break the development into sub-phases, others combine them into a common band. CFDs can also show trends to help us plan the release date. Depending on the needs.
The examples below are built on a simple cycle, showing the amount of work involved in development, testing, and the cumulative of completed functionalities.
In this article we will not dwell on the basics of CFDs such as Little’s Law and the relationship between WIP and Cycle Time. There are plenty of other sources for that. Instead, we will look at the more advanced topic of CFD pattern interpretation. These reveal details of team dynamics that may be hidden at first sight.
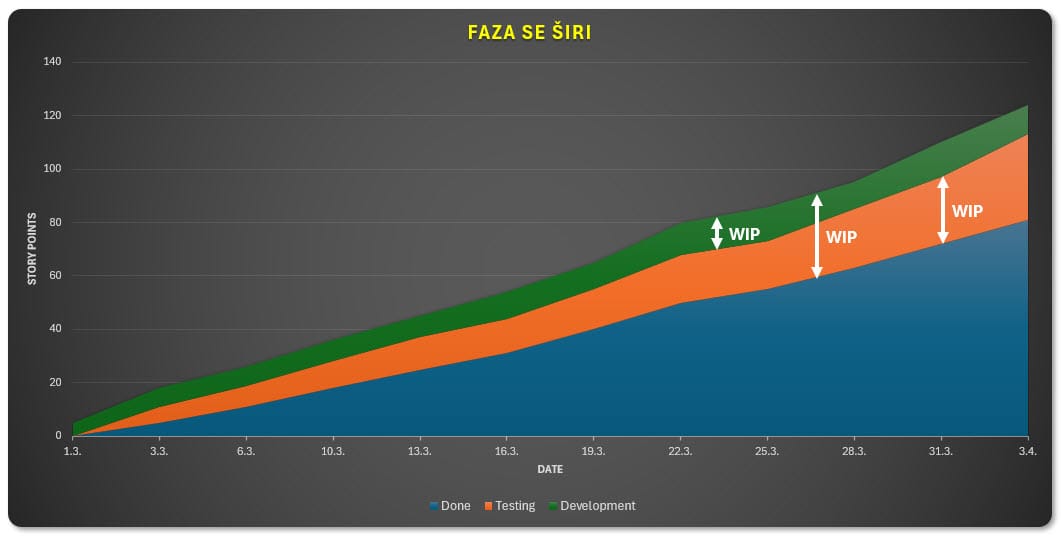
The phase (ribbon) is expanding
Common pattern. In our case, testers are taking developed functionalities into testing faster than they can process them. As a consequence, the queue of functionalities (user stories) waiting to be tested gets longer. In the graph, this can be seen as an expansion of the Testing strip and its WIP.
A higher WIP will consequently lead to a longer Cycle Time, which slows down the flow of functionality through the development process. An additional negative factor is that at a certain point, testers will start multitasking due to time constraints, which will further reduce their productivity. Statistically, each additional parallel task reduces productivity by 20%.
Solutions
- Immediate suspension of the takeover of developed functionalities into the testing phase.
- Implementation of appropriate WIP limits to ensure that no more functionality is taken into the testing phase than can be handled by the testers on an ongoing basis. If WIP limits are already set, they are probably too high and need to be lowered. Ideally, the average “inflow” into a development phase is equal to its “outflow”. Visually, this would mean that the strip of a particular phase remains more or less the same width (not widening or narrowing) over time.
- Integrating additional testers into the team. It is important to be aware that when new members are added to the team, it has to repeat the journey through Tuckman’s development phases. In practice, this means that the productivity of the team will be lower for some time after the inclusion of new members, before increasing.
- In the case of interdisciplinary teams where members have overlapping specializations, developers can help testers to reduce the testing backlog.
- If we are lucky, and our team is predominantly interdisciplinary, it is worth considering a WIP limit at team level, not just at individual stages. An overall limit covering all development phases automates the optimisation of the flow through the whole process. In practice, this means that we have limited the number of backlog entities that can be present on the kanban table at the same time.
- The widening of the development phase band can be a normal consequence of adding members to the team. In this case, the WIP capacity of that phase will usually increase over time. Unless this is supported by a steeper slope representing completed functionalities (blue), such a team has not achieved higher productivity with the new members. There are two possible reasons for this:
- The Team has not yet successfully integrated the new members into its development process
- There are too many members in the team, which makes coordination between them too difficult and results in lower productivity of the individual members (Brooks’ Law).
- If only the test phase band is expanding, this may also indicate an unsatisfactory quality of the development phase output (green). In this case, it is probably necessary to update the Definition of Done (Scrum) or the process policies (Kanban).
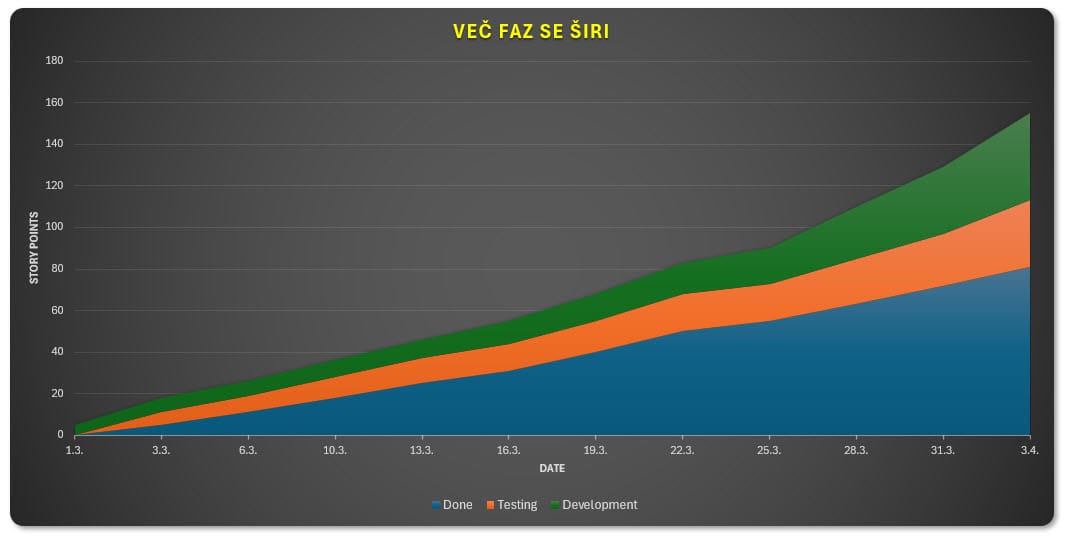
Several phases are expanding
Same as above, except that multiple bands are expanding at the same time. Increasing WIP means longer Cycle Time and slower flow of functionality through the development cycle. Higher WIP also usually results in multitasking of developers, which is one of the most important Lean wastes.
Solutions
- Stopping the intake of new functionalities in the affected phases until their WIP is reduced.
- Lowering the WIP limits. If these have not been exceeded despite widening of the bands.
- Enforcement of the WIP limits in a vigorous manner. The columns of the defined development phases in the Kanban table are divided into “In progress” and “Completed“. This will help us to identify bottlenecks in the process. We can also set the WIP limit for the entire development phase, which includes both the “In Progress” and “Completed” columns.
- It is necessary to identify the root cause of the phenomenon. Some possible reasons:
- When requesting new functionalities, management bypasses Product Owner or Product Manager and talk directly to developers.
- Scope creep
- WIP limits are too high
- Too narrow specialisation of team members (different phases cannot help each other)
- Is there a bottleneck in any of the phases and therefore WIP is accumulating in the previous phases?
Planes
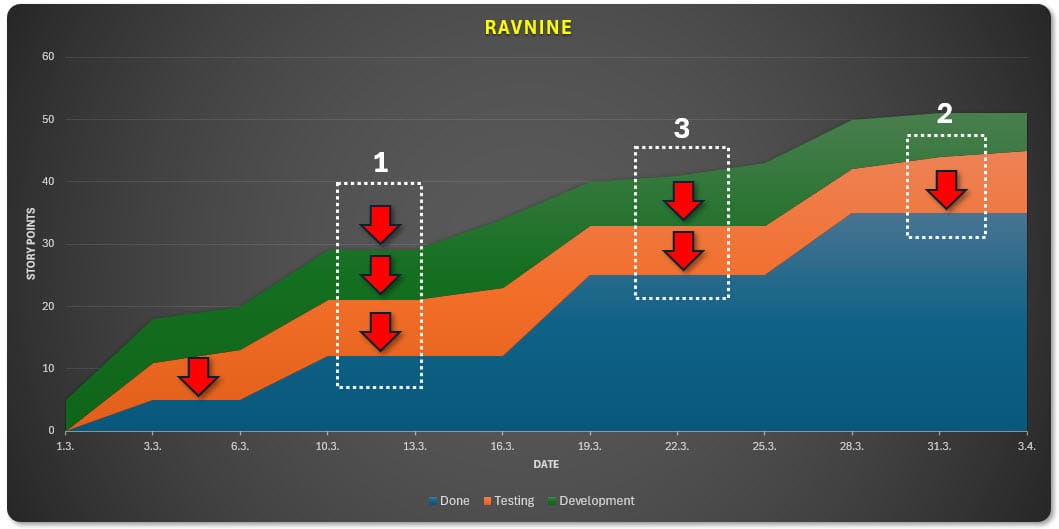
In CFD, planes mean that functionalities do not move through the process. Identification of blockages is needed.
Solutions
- If the flatness occurs at the same time in all phases (1), we are probably talking about external factors such as holidays, vacations, training or system upgrades that hinder the team’s work.
- If the plane appears above and below a certain phase (3), there is a blockage in that phase. Tested functionalities do not go to Done, and the Testing phase (due to the WIP limit reached) does not take over prepared functionalities from the previous phase. Maybe the testers started multitasking due to too high WIP limit? Maybe the problem is the availability of the testing infrastructure? Maybe the team is waiting for external approvals? The Scrum Master’s job is to help the team identify the blockage and guide them towards a positive solution. In Kanban, this is usually the task of the product manager.
- Assuming that the WIP limits are reached and the plane only appears in one phase (e.g. between Testing and Done) (2) and the phase above it (Testing) is expanding, this means that there is insufficient communication within the team. There is no point in bringing new functionalities into the process if the old ones have not been processed yet. In such a case, the Scrum Master guides the team to use good communication practices that will take it from the Norming phase to the Performing phase. If the team has reached multidisciplinarity, where for example programmers can help testers and vice versa, it is worth considering setting a WIP limit for the whole team (kanban board).
- Flats can also be the result of too large user stories. In this case, the problem is with the Backlog Refinement and Sprint Planning process, which are not detailed enough (for the upcoming Sprint). This issue should be addressed by the Scrum Master at the next Sprint Retrospective. Too many user stories increase the risk that the team will not produce any business value at the end of the Sprint in case of unforeseen problems. If team practices Kanban, the problem is also insufficient decomposition of backlog items by the product manager and the development team.
Stairs
Not necessarily problematic. It means that business value is realised in batches at a regular cadence (if the steps are evenly spaced). Agile tends towards continuous business value creation, regardless of iteration frames. From this point of view, batch delivery of business value represents a departure from the ideal, but is sometimes conditioned by external factors.
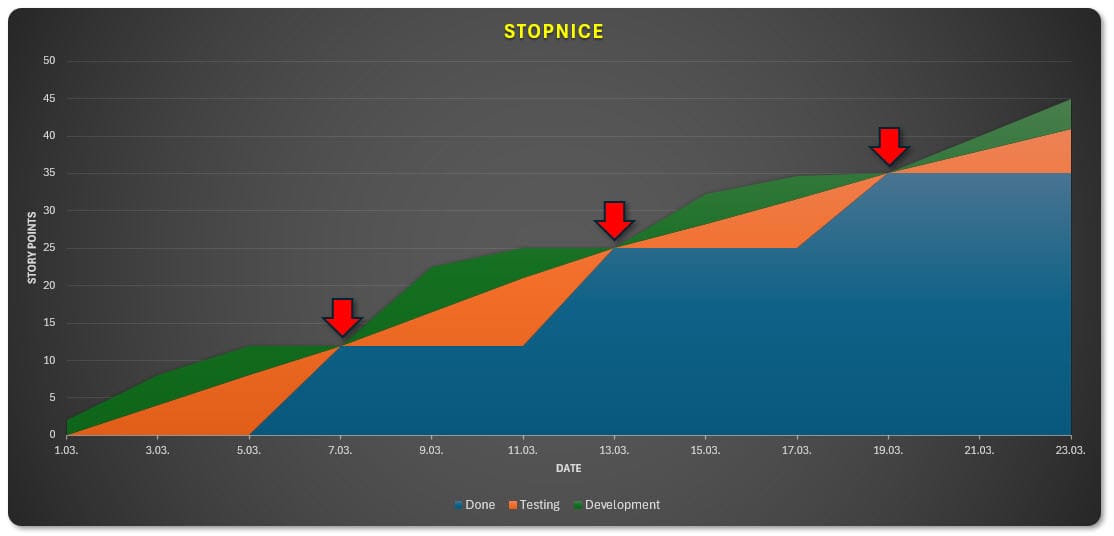
Solutions
- Check whether the Sprints are too short. Maybe the last development phase “Preparing for Production” is so time consuming that it takes an exceedingly large share of a short Sprint. In our chart, Sprints are probably only six days long.
- The functionalities taken over for development are not broken down into sufficiently small user stories. Try to break them down into smaller stories. A typical user story should represent 1 – 4 working days.
- Try to set up a Continuous Deployment/Delivery (CI/CD ) system to speed up the integration of developed functionalities into production. The DevOps philosophy is the ideal of such a process. The same applies to DevOps as to TDD: Organisations that believe they do not yet need this approach should start educating their engineers in this direction now. By the time they need DevOps, it will be too late to find the staff and set up the system. DevOps engineers are relatively rare and consequently expensive.
The phase disappears
If the band of a developmental phase disappears, this usually means that we are witnessing phase skipping.
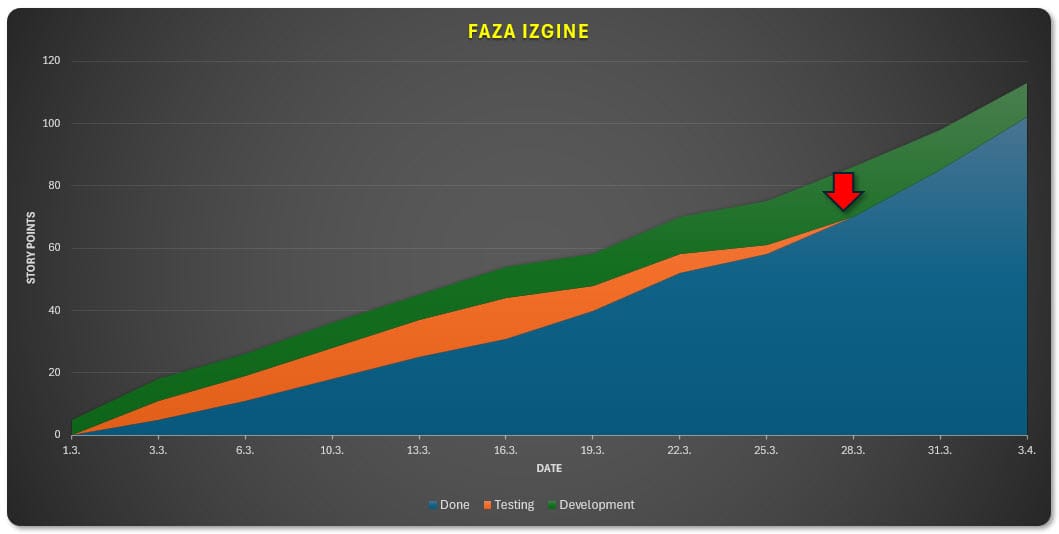
Solutions
- Check with the team whether the phase that disappeared made sense. Maybe the team decided to eliminate it because the developers don’t see any added value in it – they see it as purely administrative.
- The phase became so automated that it became trivial and the team merged it with another phase.
- Maybe the band is not visible because the visualisation granularity in CFD is too large and needs to be reduced?
- Maybe the phase has no clear ownership and needs to be defined?
- Check whether the team has just stopped recording the WIP of this phase. Find out the reason.
- Divide the development phase columns on the Kanban board into “In progress” and “Completed“. This will help us to identify any blockages in the process.
S-curve
A common pattern. May indicate process inefficiency. Such a trajectory over a long period of several Sprints makes planning more difficult. It is normal for the bands to gradually widen at the beginning of a development or Sprint and narrow at the end. The problem may be the intermediate period where the strips ideally progress linearly, not in an S-shape. As far as productivity itself is concerned, such a situation is positive, but it can result in team burnout.
In my opinion, such a pattern within a single iteration/sprint is not problematic. The testing phase often has a zero at the beginning of the WIP, which is a normal consequence of the dynamics of the development cycle (there is nothing to test until the functionality or part of it is developed). Likewise, at the end of the Sprint, we want the development and testing activities to be slowly winding down. Scrum by no means requires 100% utilization of team members.
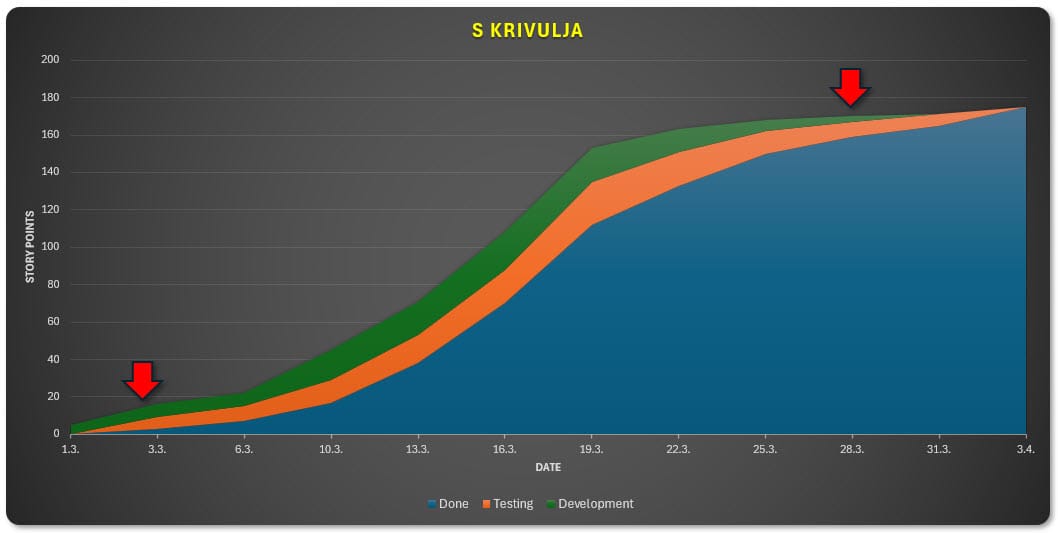
Solutions
- If the first development phase at the start of a Sprint has a WIP of zero and this is gradually increasing, we have a problem in Sprint planning. The team should immediately take as much functionality as is its capacity into development without multitasking (they do not start at zero). The exception are teams that practice one-piece-flow. Such teams take only one functionality (user story) into development at a time and develop it in such a way that there are no other functionalities in each development phase at the same time (WIP limits of all development phases are 1).
- If the last development phase (Testing) at the end of the Sprint has a high WIP and consequently a high Cycle Time, it would be a good idea to involve additional members in the testing. Ideally existing developers in the team who have not been involved in testing so far. In this case, we assume that the development phase is mostly complete and we have developers available to take over the testing part. By engaging existing members, we avoid the organizational stress of taking on new team members (Tuckman).
- Consider whether the S-curve is even problematic in our situation. It could be just the result of a well-coordinated team that needs some time to “warm up” and its members are already partially engaged in other projects towards the end of the project.
Conclusion
CFD diagrams are useful in both Scrum and Kanban.
They show us:
- Where the work (and therefore the risk) accumulates
- Where are the inefficiencies in the development process.
Without interpretation, CFDs are just another KPI. Their value lies in the interpretation of observed anomalies.
CFDs are one of the visual tools we learn about in the Scrum Master course.